thumbnails with links to full size images
project form:
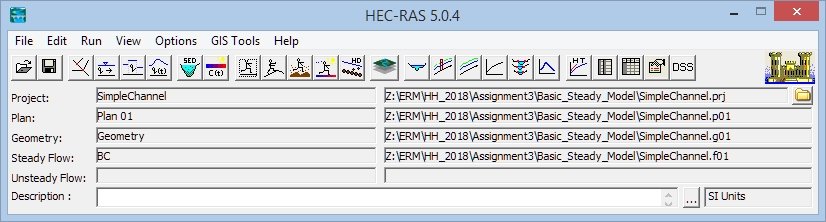
open the basic steady model file SimpleChannel.prj
Unsteady Flow Data
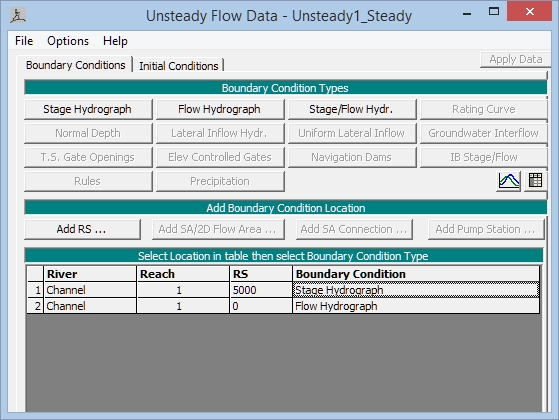
unsteady flow data form:
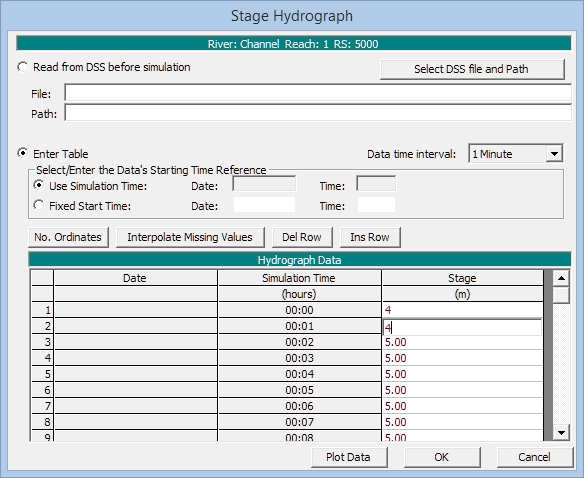
stage hydrograph form:

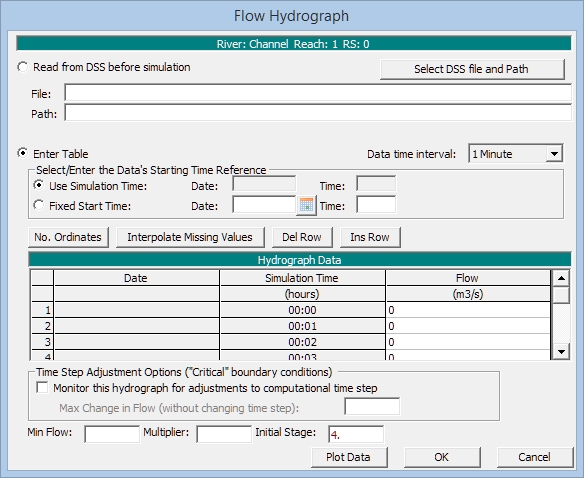
flow hydrograph form:
save the Plan in a new file with suitable name
always save the file after any change
select for the river station (RS) 5000 the boundary condition Stage Hydrograph
specify the stage in the table:
using a Data time interval of 1 Minute and No. Ordinates to 121 (-> 2 hours)
specify for the 1st and last Stage (m) value 4,
all other values can be interpolated by Interpolate Missing Values
select for the river station (RS) 0 the boundary condition Flow Hydrograph
specify the flow in the table:
using a Data time interval of 1 Minute and No. Ordinates to 121 (-> 2 hours)
specify for the 1st and last Flow (m3/s) value 0,
all other values can be interpolated by Interpolate Missing Values
set the Initale Stage as initial conditional to 4 m
Unsteady Flow Analysis
unsteady flow anlaysis form:
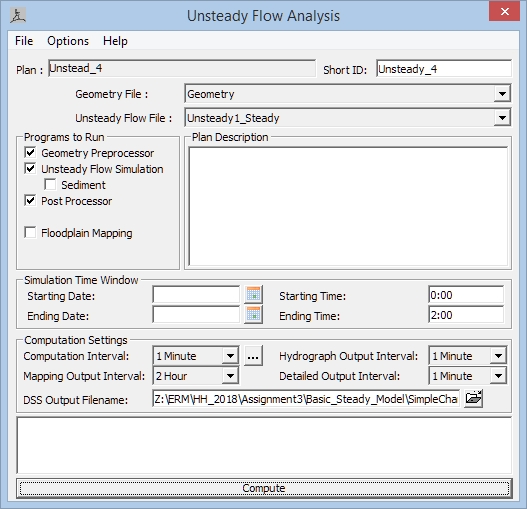
activate Geometry Preprocessor, Unsteady Flow Simulation and Post Processor
set Starting Time to 00:00
set Ending Time to 02:00
set Computation Time (time step) to 1 Minute
set Hydrograph Output Interval to 1 Minute
keep Mapping Output Interval on a high value (e.g. 2 hours, we are not generating maps)
set Detailed Output Interval to 1 Minute
save the Plan in a new file with suitable name
finally run the simulation by the Compute button
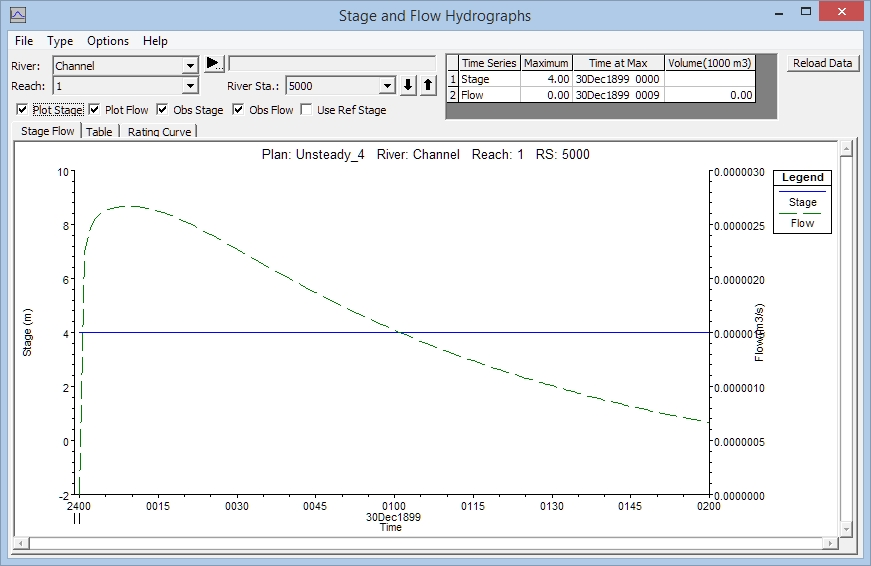
hydrograph diagram:
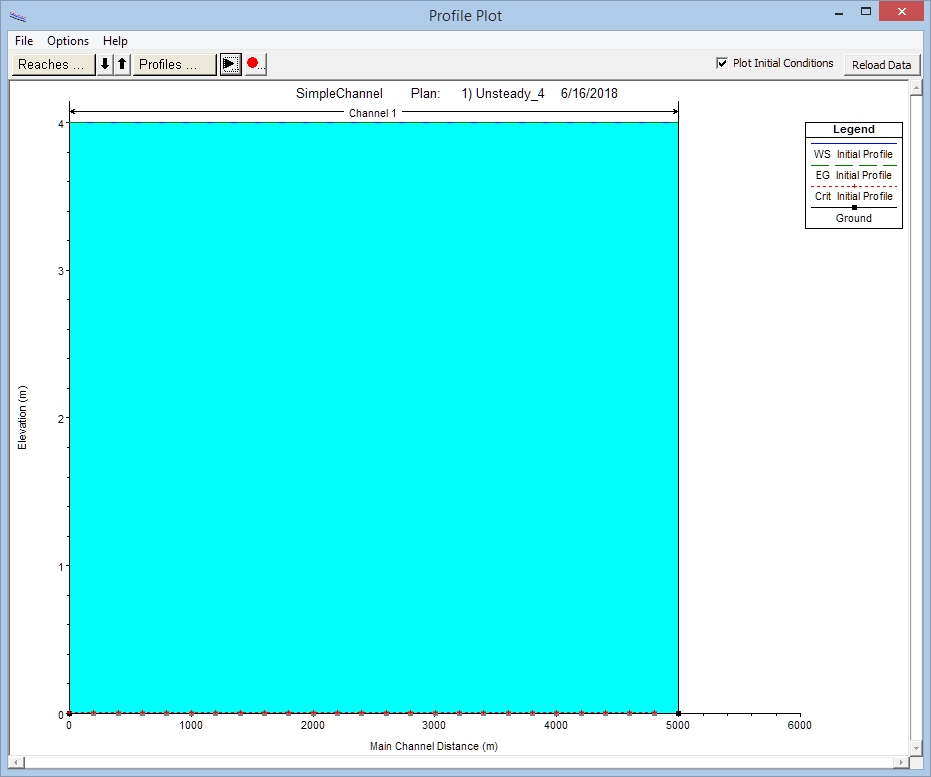
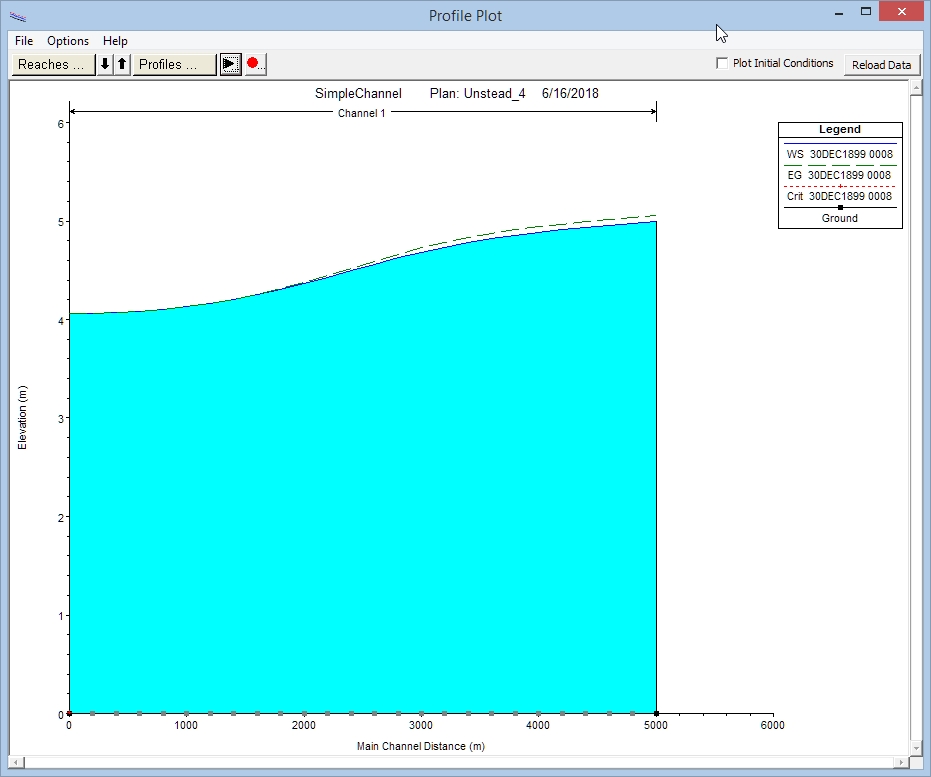
profile plot:
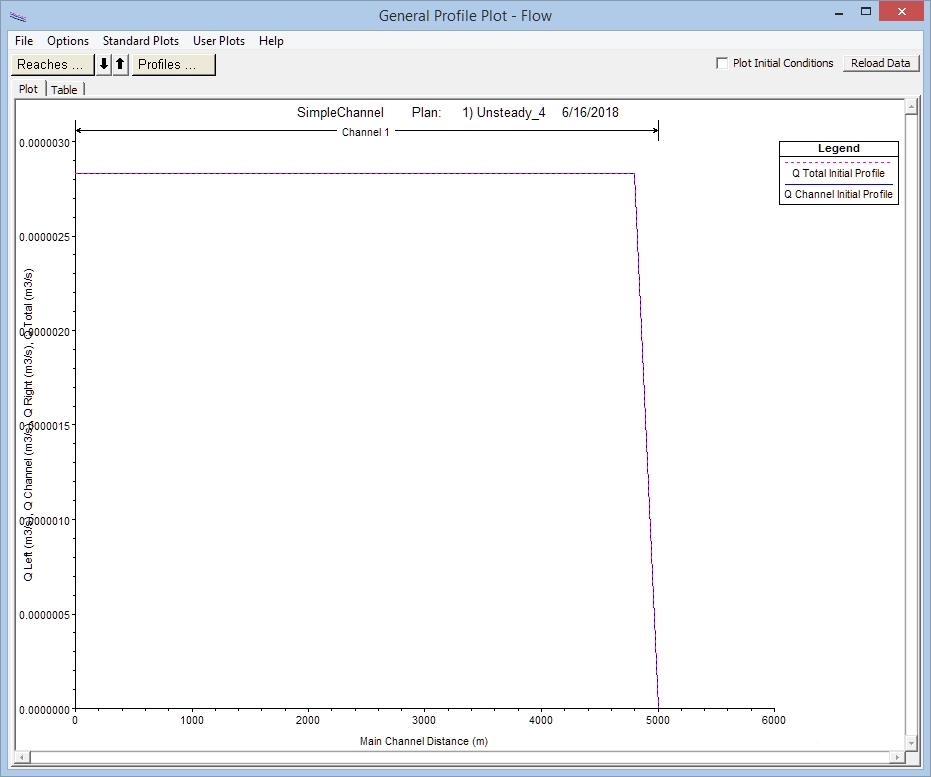
general profile:
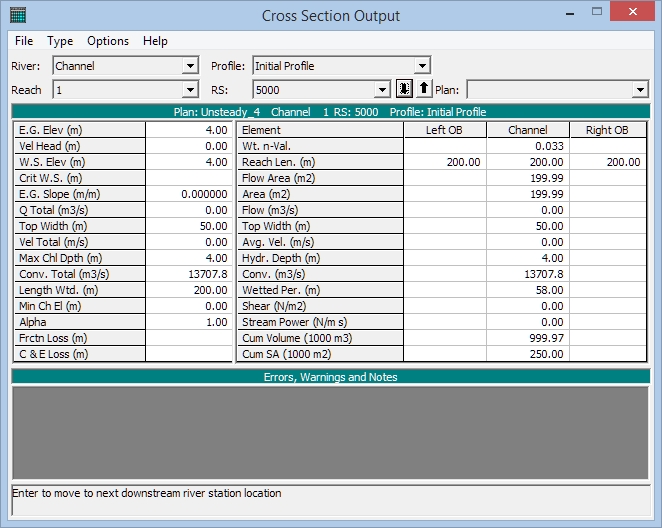
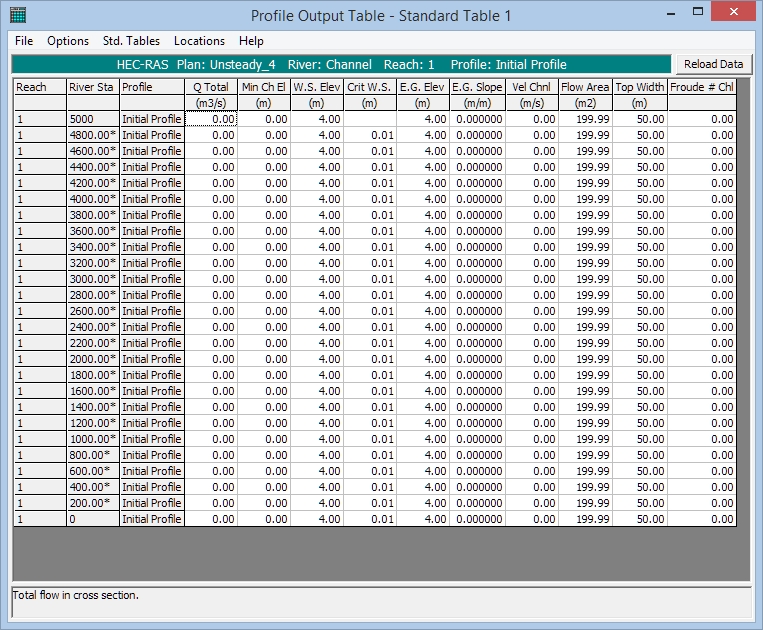
cross section table
profile table:
use Stage and Flow Hydrographs to analyse the h(t) and Q(t) time series upstream and downstream
use Water Surfave Profile to analyse the water surface in a longitudal profile h(x)
use General Profile to analyse the result values R in a longitudal profile R(x)
use Detailed Output Tables to get access to all relevant numbers for cross sections
use Detailed Output Tables to get access to all simulation numbers in time and space
stage hydrograph:
profile plot:
hydrograph diagram:
change the Stage Hydrograph upstream:
increase the water surface elevation after 2 min from 4 m to 5 m
analyse the results (step 4.) and specify the travel time of the wave from the result numbers
compare your result analytic insight from hydraulics
the speed of a gravity wave in shallow water is sqrt(g*h)
the time to run 5000 m is 5000 / sqrt(g*h)
for 4 m this is 5000 / sqrt(9.81*4) = 798 sec = 13,3 min